A comprehensive Excel-based Risk Register template to track all your Information Security risks.
It is expected that you have some basic familiarity with Risk Management and Excel to effectively work with the template.
You might also like…
- I have a Risk Assessment template could be used as a companion resource for the Risk Register.
What’s special about this Template?
The template comes with a comprehensive Risk Register that uses a 5×5 risk matrix. Additionally, I have tried to make this template unique by adding features such as:
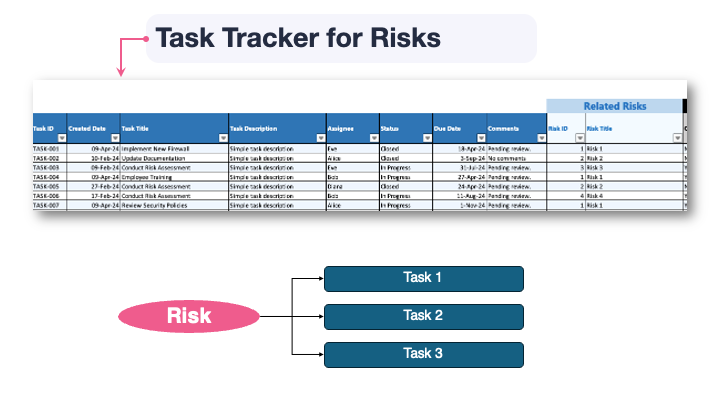
- Task Tracker to track the work that you do to mitigate risks
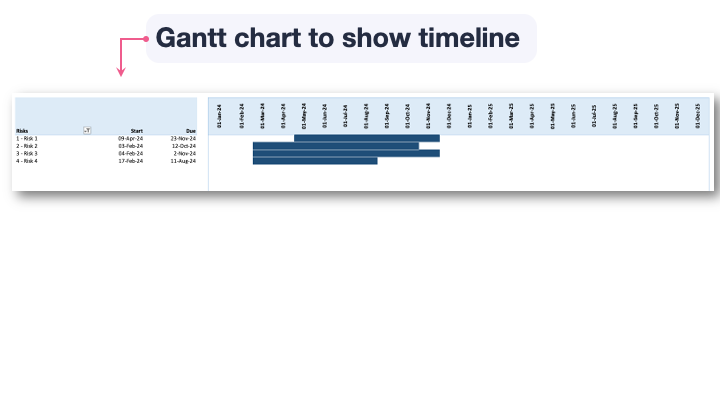
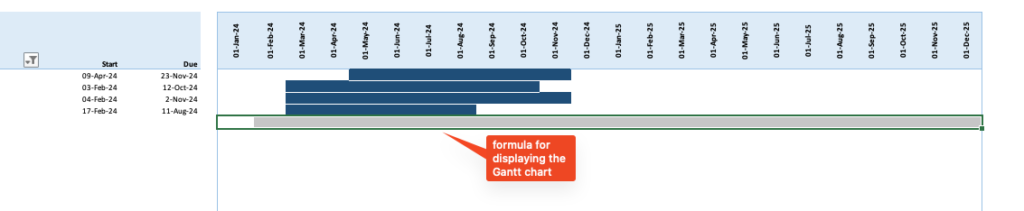
- Gantt chart to demonstrate the timeline for risk mitigation
- Dashboards and metrics
Here’s a sneak peak of what you will see. I hope all of you like it and find it useful in your work.
The template includes 20 sample risks and 20 sample tasks, allowing you to see how everything fits together.
Who should not use this Template?
Organizations Following NIST’s Risk Management Framework
If your organization is required to follow the risk management process in NIST’s SP 800-37 publication, then this template is not suitable. NIST’s risk management approach is based on a slightly different methodology than the one used in this template. Instead, you can use the sample template provided by NIST, available here.
Organizations Using a Quantitative Approach
If you use a quantitative risk assessment methodology then this template is not the right one for you.This template is designed for qualitative risk analysis and relies on risk matrices.
Although risk matrices are very popular, there are many valid disadvantages to using it. A good primer on this can be found on this Wikipedia page and I also recommend the excellent book, How to Measure Anything In Cybersecurity Risk by Douglas Hubbard and Richard Seiersen to know more on this. I also recommend reading about the FAIR Institute’s cyber risk framework.
Organizations Using Asset Valuation
A lot of organizations use a risk valuation methodology where the value of the affected assets are a factor. This template uses impact and likelihood as factors to value a risk and does not include asset valuation.
Risk Rating methodology
The Risk Rating methodology is visually explained in this graphic.

The valuation of a risk is done by multiplying the numeric rating for likelihood by the numeric rating for impact to obtain a total risk value, which then falls into one of the Low, Medium, or High categories depending on the resulting value.
For example, a risk with a Moderate “Impact (3)” and Likelihood rating of “Likely (4)” with would yield a Risk score of 12 (3 × 4), placing it in the “Medium” risk zone.
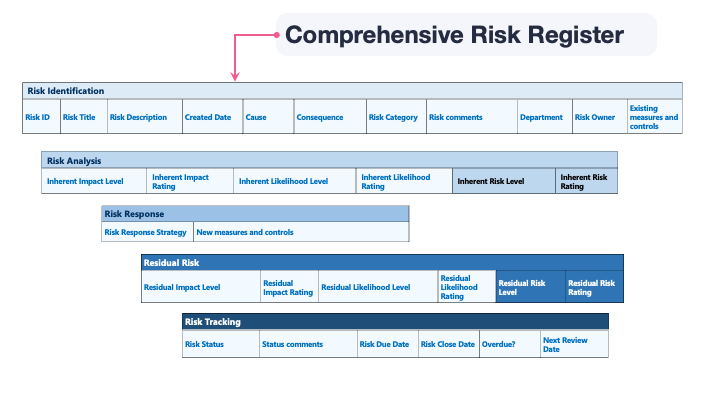
Risk Register – columns explained
The following is a short description of each of the fields (columns) used in the Risk Register tab of the template.

- Risk ID – A unique reference number assigned to each risk for easy tracking. I have pre-filled this column till around 1000.
- Risk Title – A short title for the risk.
- Risk Description – A short description about the risk.
- Created Date – The date on which the risk was added to the register.
- Cause – The underlying root cause that lead to the emergence of this risk.
- Consequences – The potential outcomes or impacts if the risk materializes; the negative outcome for the organization.
Some organizations use both Cause and Consequences and other include this information in the Description. Feel free to delete these if you do not use it.
- Risk Category (dropdown) – A classification that groups risks of a similar nature.
- Risk Comments – Any additional remarks, context, or notes that you want to add about the risk.
- Department (dropdown) – The organizational unit or team responsible for managing or impacted by the risk.
- Risk Owner – The person or role accountable for monitoring and mitigating the risk.
- Existing Measures and Controls – Description of the protections that exist and has a risk reduction effect.
Inherent Risk
When evaluating Inherent Risk, I suggest considering the impact of existing controls when determining the appropriate impact and likelihood. This differs from the traditional approach where Inherent Risk is assessed under the assumption that no controls are in place. For further reading, check out this post from the FAIR Institute: Inherent Risk vs. Residual Risk Explained in 90 Seconds.
- Inherent Impact Level (dropdown) – The impact of the risk, derived from the Impact table in the Rating Factors tab.
- Inherent Impact Rating (auto calculated) – The numerical value for the selected Impact Level. As you change the Impact Level, this will change.
- Inherent Likelihood Level (dropdown) – The probability of the risk materializing, derived from the Likelihood in the table in the Rating Factors tab
- Inherent Likelihood Rating (auto calculated) – The numerical value for the selected Impact Level. As you change the Impact Level, this will change.
- Inherent Risk Level (auto calculated) – The level of risk derived from the selected Inherent Impact and Inherent Likelihoods.
- Inherent Risk Rating (auto calculated) – The numerical value of risk derived from the selected Inherent Impact and Inherent Likelihoods ratings columns.
Risk Response
- Risk Response Strategy (dropdown) – The chosen approach (e.g., accept, mitigate, transfer) for dealing with the risk.
If the response strategy is to accept the risk without any new controls, make sure that the Inherent and Residual Risk ratings are the same. - New Measures and Controls – Additional actions or proposed controls to reduce the likelihood or impact of the risk.
Residual Risk
All the below columns are similar to the Inherent risk related columns above and work in a similar fashion.
- Inherent Impact Level (dropdown)
- Inherent Impact Rating (auto calculated)
- Inherent Likelihood Level (dropdown)
- Inherent Likelihood Rating (auto calculated)
- Inherent Risk Level (auto calculated)
- Inherent Risk Rating (auto calculated)
Tracking
- Risk Status (dropdown) – The current state or phase of the risk in its lifecycle.
- Risk Review – The process or notes relating to regular examination and reassessment of the risk.
- Status Comments – A column to add notes about the status of the risk.
- Risk Due Date – The deadline by which the risk should be closed.
- Risk Close Date – The actual date the risk was closed.
- Overdue? (auto calculated) – A column that tells you if a risk is overdue or not. This will work only if you fill the due date.
- Next Review Date – The scheduled date for the next formal evaluation of the risk.
Task Tracker- columns explained
The following is a short description of each of the fields (columns) used in the Task tab of the template.
- Task ID: A unique reference number assigned to each risk for easy tracking. I have pre-filled this column till around 1000.
- Created Date – The date on which the task was created.
- Task Title – A short title for the task.
- Task Description – A short description about the task.
- Assignee – The person responsible for completing the task.
- Status (dropdown) – The current state or phase of the task in its lifecycle.
- Due Date – The deadline by which the risk should be closed.
- Comments – Any additional remarks, context, or notes that you want to add about the task.
Related Risk
- Risk ID – The risk for which the task is performed.
- Risk Title (auto calculated) – The title of the risk, automatically retrieved from the Risk Register tab.
Metrics in the Dashboard tab explained
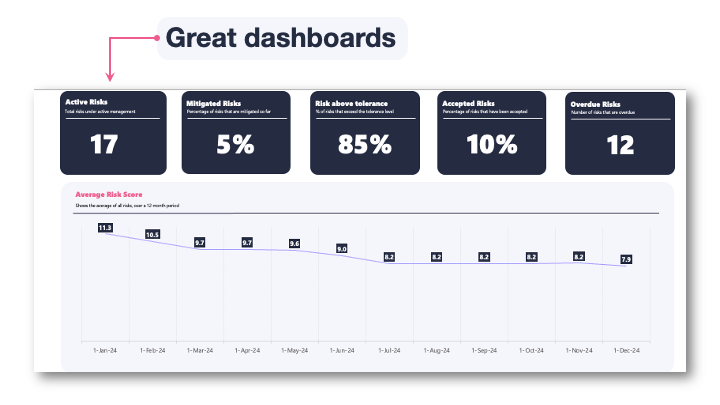
- Active Risks: The total number of risks currently being managed.
- Mitigated Risks: The percentage of risks that have been reduced or eliminated through risk treatment.
- Risk Above Tolerance: The percentage of risks that exceed the organization’s acceptable risk threshold.
- Accepted Risks: The percentage of risks that have been acknowledged and formally accepted by the organization.
- Overdue Risks: The number of risks that have not been addressed within the required timeframe.
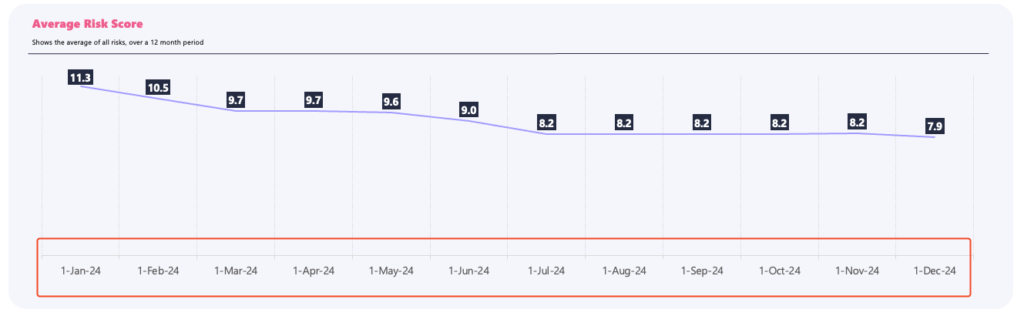
- Average Risk Score: The overall average risk score calculated over a 12-month period. This shows how your risk reduction efforts have progressed over time.
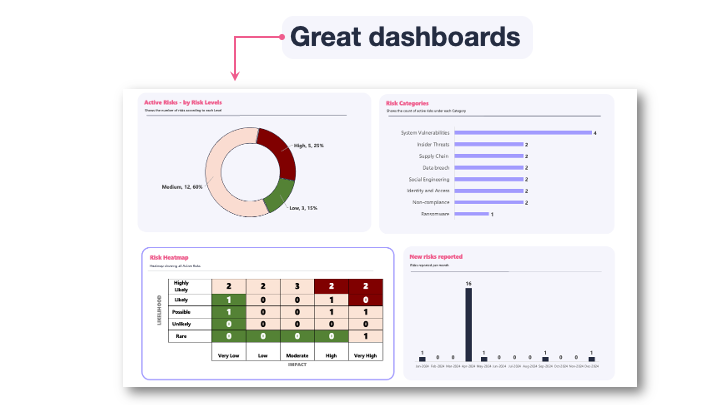
- Active Risks by Risk Levels: A breakdown of active risks categorized as low, medium, or high severity.
- Risk Categories: The distribution of active risks across different categories such as vulnerabilities, insider threats, and compliance issues.
- Risk Heatmap: A visual representation of risk likelihood and impact, highlighting areas of highest concern.
- New Risks Reported: Tracks the number of newly identified risks over time.
It’s too complex! What if I don’t want to use all the advanced features?
Simple! Keep the Risk Register and Dropdowns tabs and delete the rest.
Using the Template
How do I update the Dashboard?
The Dashboard auto-adjusts so there is nothing much you need to do.
The only thing is the timeline for the Average Risk Score which is based on the RiskTimeline tab.
To update this timeline,
- Go to RiskTimeline tab
- Add your preferred date in the Timeline start cell. This will update the date calculations in the Timeline Area and this will be reflected in the Average Risk Score dashboard.
How do I update the Gantt chart?
Steps to Update the Gantt Chart
To update the Gantt chart, follow the steps below:
- Add tasks in the Task tab along with the Risk information
- Refresh the Pivot table in the Gantt chart tab. The Gantt chart will now be updated.
Handling more than 100 rows in the Gantt chart
One thing to remember is that the Gantt chart is displayed with formulae and the default template comes with 100 rows with the formulae pre-filled.
If you cross more than 100 risks in the Gantt chart, just copy the 10 cells containing formula in the new row.
Risk Register tab- I have reached 1000 records. How do I add a new row?
Just add a new row by following the steps below:
- Right-click on any cell in the last row
- Select Insert and then Table Row Below
Tasks tab- I have reached 100 records. How do I add a new row?
Similar to the above, just add a new row by following the steps below:
- Right-click on any cell in the last row
- Select Insert and then Table Row Below
How to add new entries for the dropdowns?
All dropdowns used in the Template can be found in the Dropdowns tab. I recommend adding a new entry using by Inserting a new row so that the integrity of the dropdowns are maintained throughout the Template.
Customizing the Template
If you know your way around Excel, please feel free to modify the template.
The most common change I anticipate is around Impact, Likelihood and Risk Ratings. The default template comes with a 5×5 matrix. Feel free to change this as you please.
When you change the matrix, remember to update the following:
- Risk Ratings table in Rating factors tab
- Risk Heatmap in the Dashboard
