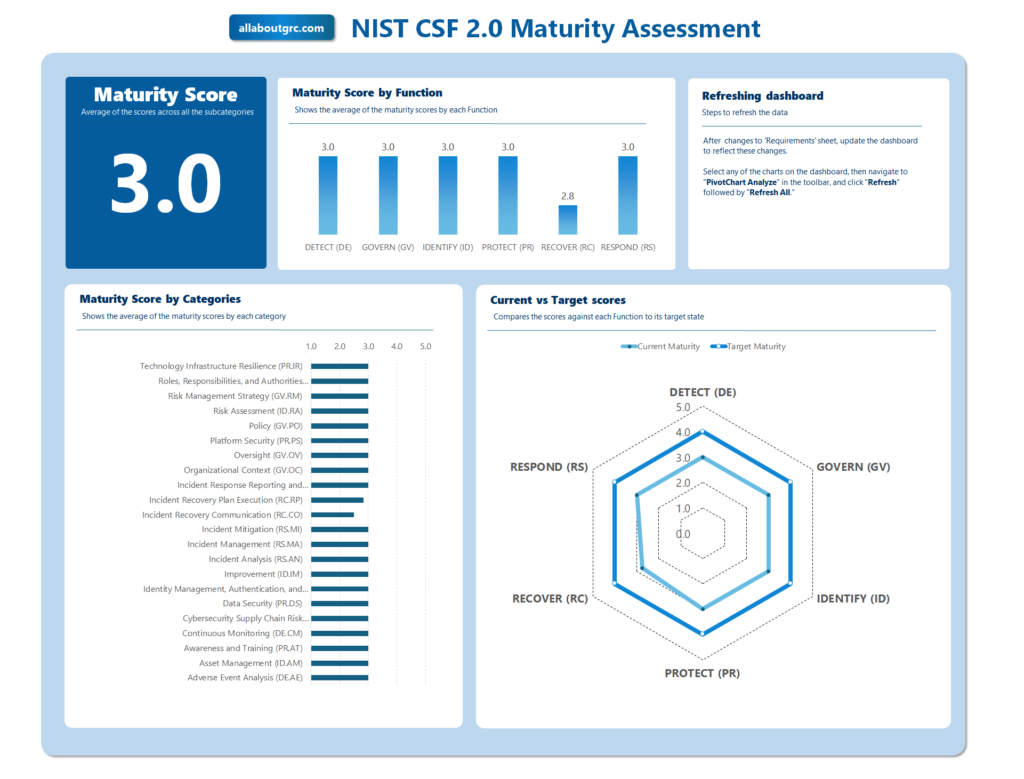
An easy to use tool to assess your organization’s Cybersecurity Maturity using the NIST’s CSF 2.0 framework.
Disclaimer
- The NIST Cybersecurity Framework is owned and maintained by the National Institute of Standards and Technology (NIST).
- Please note that this template was created independently and has not been officially endorsed by NIST.
- For more information and access to the official NIST CSF documentation, please visit the NIST Cybersecurity Framework official webpage.
- Feel free to modify the template to better suit your organization’s requirements, but if you share it on a public forum, please credit the original source.
About the Template
This Excel template contains five sheet:
- Requirements: This is the heart of the template. It lists all the outcomes from the NIST CSF framework.
- Dashboard: A visual representation of your compliance status, showing which areas are fully compliant, partially compliant, non-compliant, or not applicable.
- Pivots: A hidden sheet that contains the Pivot table used to generate the dashboard contents.
- Maturity definitions: Detailed description of the maturity levels used in the assessment.
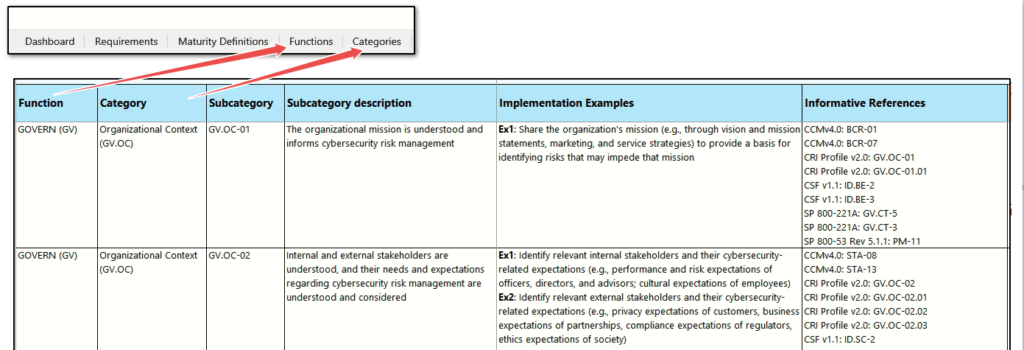
- Functions: Detailed description of the Functions as per the CSF framework.
- Category: Detailed description of the outcomes for each Category as per the CSF framework.

Who is this for?
This template can be used by anyone who wants to assess the maturity of their Cybersecurity framework based on this widely accepted framework.
The approach used here is pretty straightforward – rate the maturity of each control and compare it against the target that you would like to achieve. However, this approach differs from the one recommend by NIST.
NIST recommends developing an organizational profile and then using that to analyze the gaps and then developing a plan of action to close the gaps. If your organization is required to follow this approach then this template is not suited to you.

However, many organizations not want to develop organizational profiles. Or if you need to conduct a quick assessment—perhaps due to a request from management or for consulting purposes—this template would be well-suited for your needs.
Step-by-Step Instructions
Step 1: Understanding the Requirements sheet
This is the heart of the template.
- Function
- Category
For ease of use and reporting, I only added the respective identifiers for Function and Category. The outcome definitions for these two columns are included in a separate sheet for your reference.

The rest of content from the CSF framework include:
- Subcategory**
- Subcategory description**
- Implementation Examples
- Informative References
**CSF subcategory includes both the identifier and the outcome expected. This has been split into two in the template, again for ease of use, reporting and for any instance where you need to use formulas and do lookups.

All maturity assessment depends on the following columns:
- Current Maturity Level
- Current Maturity Score (auto-calculated when the Level is selected)
- Current Maturity Comments
- Target Maturity Level
- Target Maturity Score (auto-calculated when the Level is selected)
- Target Maturity Comments

Each row in the Requirements sheet represents a specific outcome that needs to be assessed.
Step 2: Understand the maturity levels
The template uses the following maturity levels:

These maturity levels are a modified version of the approach I first encountered in the Carnegie Mellon University’s CMMI for Services, Version 1.3:
https://insights.sei.cmu.edu/documents/855/2010_005_001_15290.pdf
I felt that this is a pretty straightforward and easy to understand model. There are many different maturity models available and you can use whichever is best suited to your organization’s needs.
Step 3: Review the Requirements
Begin by reading through each requirement listed in the Requirement column. The Informative References are very useful to understand the outcomes expected better.

Step 4: Decide the target levels
This is arguably the most critical decision to make before starting the assessment. Here are some ideas I have used in the past:
- Consult Analyst Sources: You can obtain indicative scores from sources like Gartner, Information Security Forum, or similar analyst platforms. Most of these are paid resources, so you would typically need to be a subscriber to access this information.
- Internal Brainstorming: You could also brainstorm with your colleagues about the level of maturity required for your organization in the context of the risks specific to your organization.
- Use AI!: Perplexity.ai is a really good source to get useful industry reports that you can then use as inputs. Below is a prompt I used and as you can see it has summarized the information from a publicly available research report. Perplexity links to the original source so you can then go and download the report.

After understanding the outcomes expected, you need to select what target levels you want to achieve for each subcategory and fill the sheet.

When you select the level, the score is automatically populated based on the values in the Maturity Definitions sheet. Use the Comments column to document why you selected a specific level.
Note: the template comes pre-populate with values for both the maturity level columns. You can clear the content from both the columns. See the instruction in Step 1 under the section Customization 1: Modifying only the text below.
Step 5: Select the current maturity
After reviewing the documentation, practices, records and after conducting interviews rate each requirement based on the five levels:

When you select the level, the score is automatically populated based on the values in the Maturity Definitions sheet.
As you did for the Target, use the Comments column to document why you selected a specific level.
After you have done a full assessment for a subcategory the maturity section would look something like this:

Step 5: Update the Dashboard
The dashboards are based on a Pivot table and needs to be refreshed once you make changes to the Requirements sheet.
- Select any of the charts in the Dashboard sheet like the one in the image below.
- Select the “PivotChart Analyze” option in the ribbon.
- Click on “Refresh” followed by “Refresh All.”

Customizing the template
If you are proficient with Excel, you will likely be able to understand the template design and make changes intuitively. However, if you need some guidance, the instructions below should help.
Changing the maturity levels
Customization 1: Modifying only the text
If you want to maintain the existing 5-level maturity model but only change the names of the levels, this is a straightforward process. As you can see in the image below, I have updated the default names for two levels.

The default template comes pre-filled with some values selected in the Requirements sheet and you will immediately find that the maturity scores show errors because the maturity levels are still showing the old values.
The default template comes pre-populated with values in the Requirements sheet. And when you modify the name, you will see errors in the maturity scores because the maturity levels still reflect the old names.

- Step 1: What you need to do is, delete the content in the Current Maturity Level cells by right-clicking and selecting the Clear Contents option. Repeat this for the Target Maturity Level column as well.

After clearing the old values, the new dropdowns will display the updated maturity level names. All subsequent selections will reflect the correct scores.

- Step 2: Update the dashboard values as described in Step 5: Update the Dashboard in the section above.
Customization 2: Changing number of levels
You can modify the maturity levels from the current 5 levels to 4 or even 3. In the example below, I have adjusted the structure to a 4-level model.

The default template comes pre-populated with values in the Requirements sheet. If the name is modified, you will see errors in the maturity scores because the maturity levels still reflect the old names.

- Step 1: Delete the content in the Current Maturity Level cells by right-clicking and selecting the Clear Contents option. Repeat this for the Target Maturity Level column as well.

- Step 2: Make sure you update Data Validation for all the rows in the Current Maturity Level and Target Maturity Level columns.

- Step 3: Change the VLOOKUP formulae in both Current Maturity Score and Target Maturity Score columns to match the number of rows you have in the Maturity Definitions sheet.

- Step 4: Update the dashboard values as described in Step 5: Update the Dashboard in the section above.
Now, your new maturity levels will be reflected across the template.
Changes to the dashboard
All charts in the dashboard are derived from a hidden Pivot table. You can unhide this table using the steps shown below.

The Pivot sheet will now be visible. You can use this sheet to create custom graphs and modify the dashboard according to your needs.

Version History and Updates
- v1.0 (01-September-2024): Initial version
